How to debug a production issue in 10–15 minutes using Sevalla MCP
If your production app starts throwing 500 errors, how would you fix it? Most production incidents aren't difficult because the bug is complex. They're difficult because modern infrastructure spreads the evidence across dashboards, deployment systems, logs, metrics, and cloud consoles. None of this takes deep expertise, but it forces engineers to spend time hunting for information instead of solving the problem. In many cases, the investigation takes longer than the fix itself.
With the Model Context Protocol (MCP), instead of switching over to a dashboard, you describe the symptom to an AI agent sitting in your coding tool. From there, the agent queries the platform on your behalf and reports back.
Sevalla ships an MCP server to help you do this. Let's walk through an incident where we'll deploy a healthy Django app to Sevalla, break it with a genuine regression, then hand the whole investigation over to an agent connected through MCP. The agent will find the root cause, roll back the bad deployment, and get the app back online: all from a single prompt.
What you'll learn
By the end of this tutorial, you'll be able to:
- Connect an AI coding agent to the Sevalla MCP server.
- Reproduce a genuine production incident on a live Sevalla app.
- Run an agent prompt that investigates status codes, logs, and deployments.
- Roll back a bad deployment through natural language instead of the dashboard.
- Judge where an agent belongs (or not) in a debugging workflow.
What the Sevalla MCP server is (and how it works)
Sevalla hosts applications, databases, and static sites without asking you to manage the infrastructure underneath them. Its MCP server lets an AI coding agent call the Sevalla API directly from a chat window, using plain language instead of a dashboard or a custom integration.
Most MCP servers register one tool for every API action. However, this can get unwieldy once a platform has more than a handful of endpoints.
Instead, Sevalla follows a 'Code Mode' pattern to expose only two tools:
- search lets the agent query Sevalla's OpenAPI specification to find the right endpoint and its parameters.
- execute runs the resulting JavaScript inside a sandbox to call the API.
The agent works out what to call and when, rather than picking from a fixed menu of pre-built actions. Authentication runs through OAuth too, so there's no exposed API key sitting in a config file.
Put it together, and you get an agent that can inspect logs, pull status metrics, read your deployment history, and trigger a rollback, all without you touching a browser tab.
How to debug a production issue using Sevalla MCP and an AI agent (4 steps, in 10–15 minutes!)
Here, we'll deploy a small Django app to Sevalla, break its home page with a real bug, then connect an AI agent through MCP and let it diagnose and fix the problem. While you might not ever purposefully break an app, we'll do it here so you can learn about some of Sevalla's setup process.
Before diving in, let's get the essentials sorted. Here's what you'll need:
- A GitHub account, since you'll fork one repository and edit a single file straight in the browser. There's no need to clone anything or set up Git locally.
- A Sevalla account. Signing up takes a couple of minutes. New accounts come with free credit that comfortably covers everything in this walkthrough, including the database and application hosting.
- We're using Cursor on its free tier, with the Sevalla MCP server added as a connection. If you already use Claude Code and would rather lean on an existing subscription, the same MCP server connects there too with near identical steps.
The forked sample app is a small Django project that tracks task results in a table on its home page. Once you fork the repo (and keep the main branch as-is), you can look at building the baseline app.
1. Create the database and the application
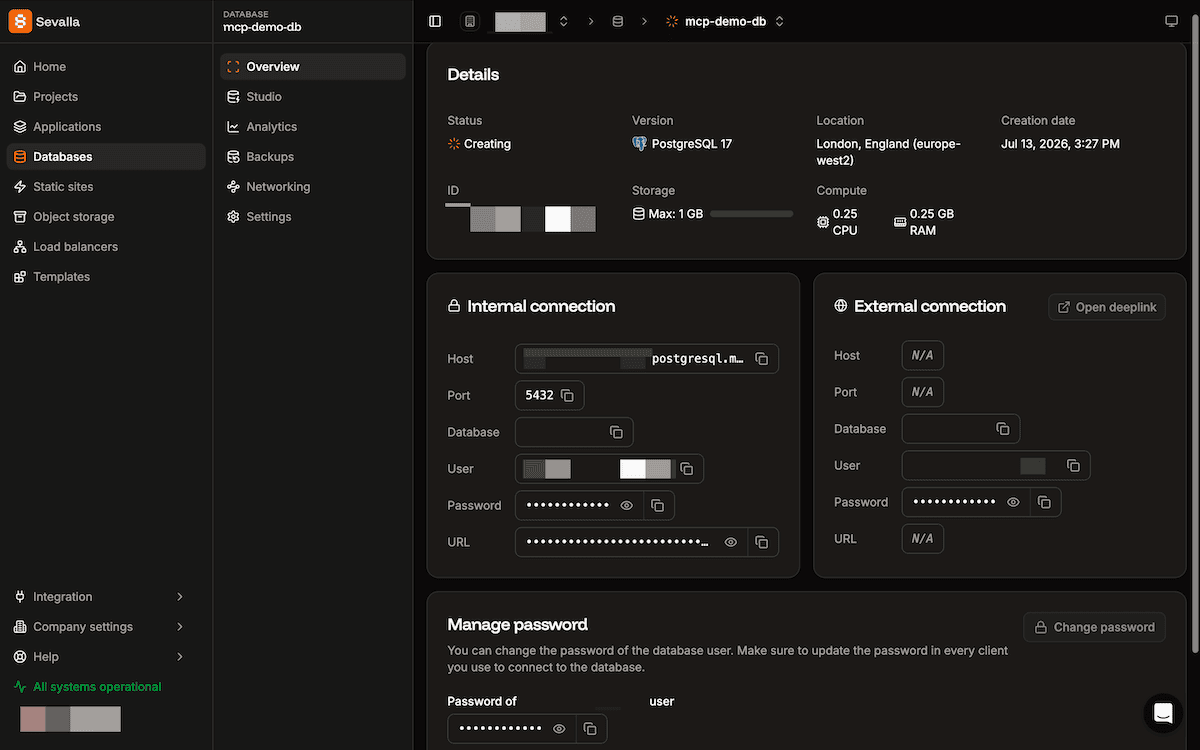
In the Sevalla dashboard, create the database. Here, choose a PostgreSQL database, pick a location close to you, give the database a name, and wait for its status to flip to Ready.
With the database ready, create the application on the Applications page. You'll need to connect it to your GitHub fork and point it at your fork's main branch. Also, make sure to turn on Auto-deploy. Next, set the application's location to match the database's. The resource tier can be left on default for this example.
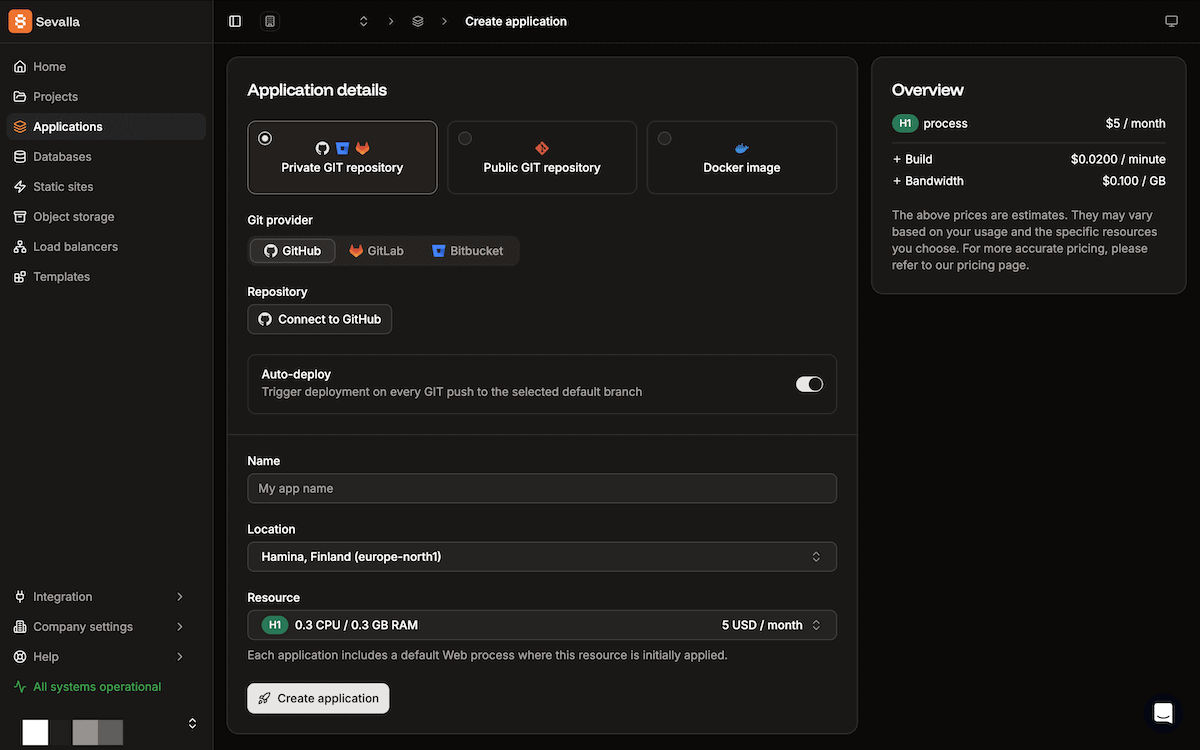
Once you create the application, it will deploy automatically and fail the first build. Because the database connection string isn't set yet, there's nothing for the app to connect to.
Connect the database, set the start command, and deploy
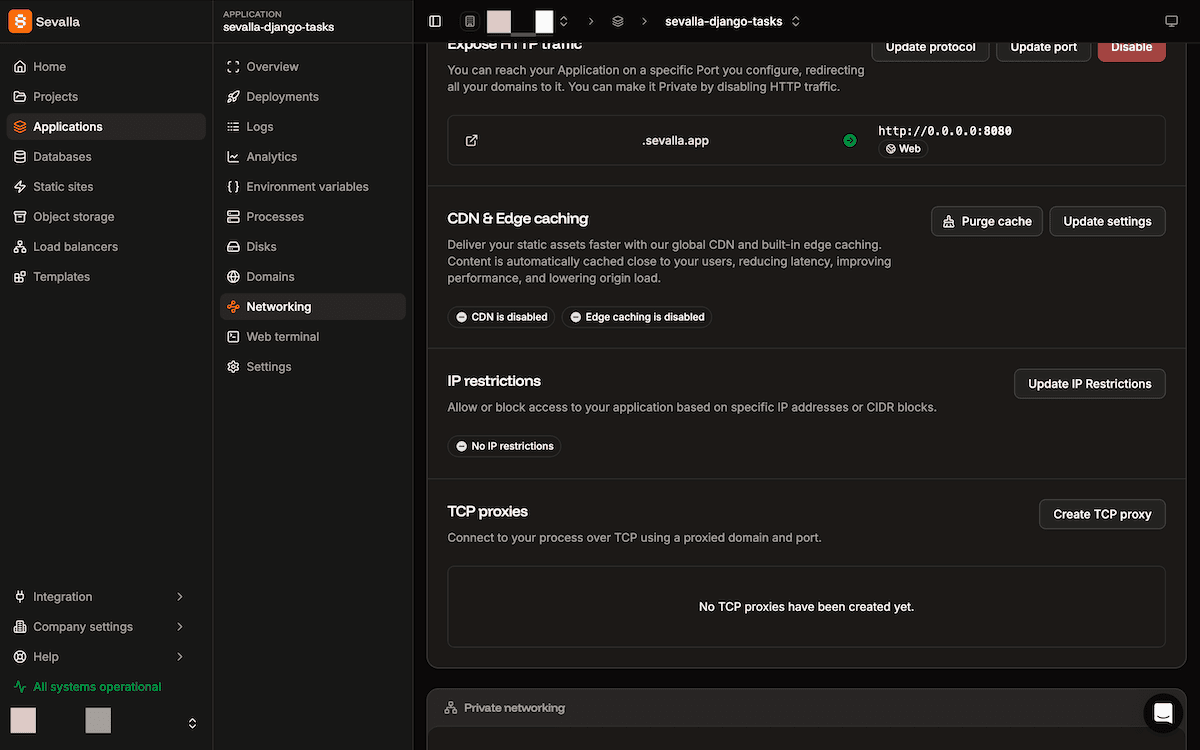
Next, head to the app's Networking tab. If you scroll down, you can add an internal connection to your database.
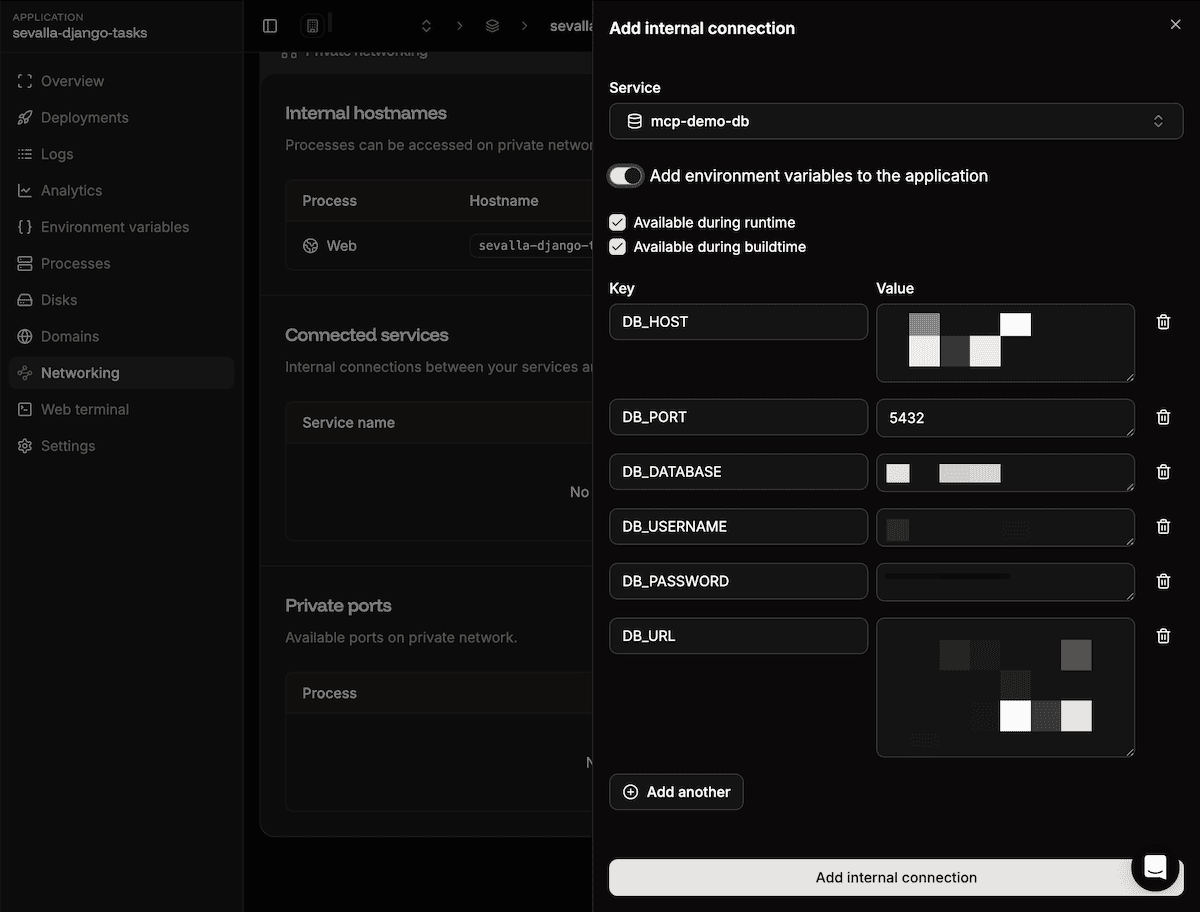
Here, check the box to add its environment variables to the application. The sample project specifically looks for a variable named DB_URL, so it's worth double-checking that the connection string lands under that name.
Next, head to the Processes screen. You'll want to click the 'three dots' on the right-hand side to update the web process's start command:
python manage.py migrate && gunicorn core.wsgi -b 0.0.0.0:8080Sevalla routes public traffic to container port 8080 by default. Inside the start-command context, the $PORT variable can come through empty. Binding straight to 8080 sidesteps the whole issue.
Now, deploy again from the Deployments tab. Once the build finishes, open the app's domain in your browser. You should see a yellow 'No tasks found' box.
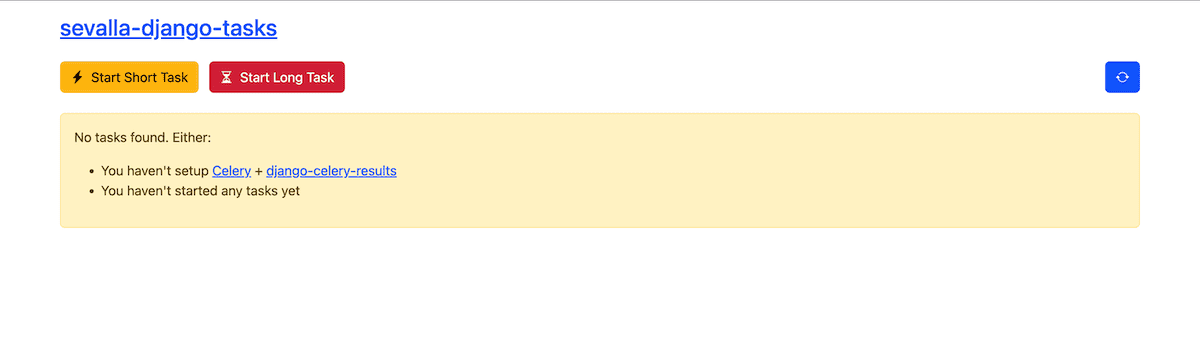
This means the home page is loading fine and returning a 200 status code. Make a mental note of this deployment as it's the version the agent rolls back to later on.
2. Break the app with a real production bug
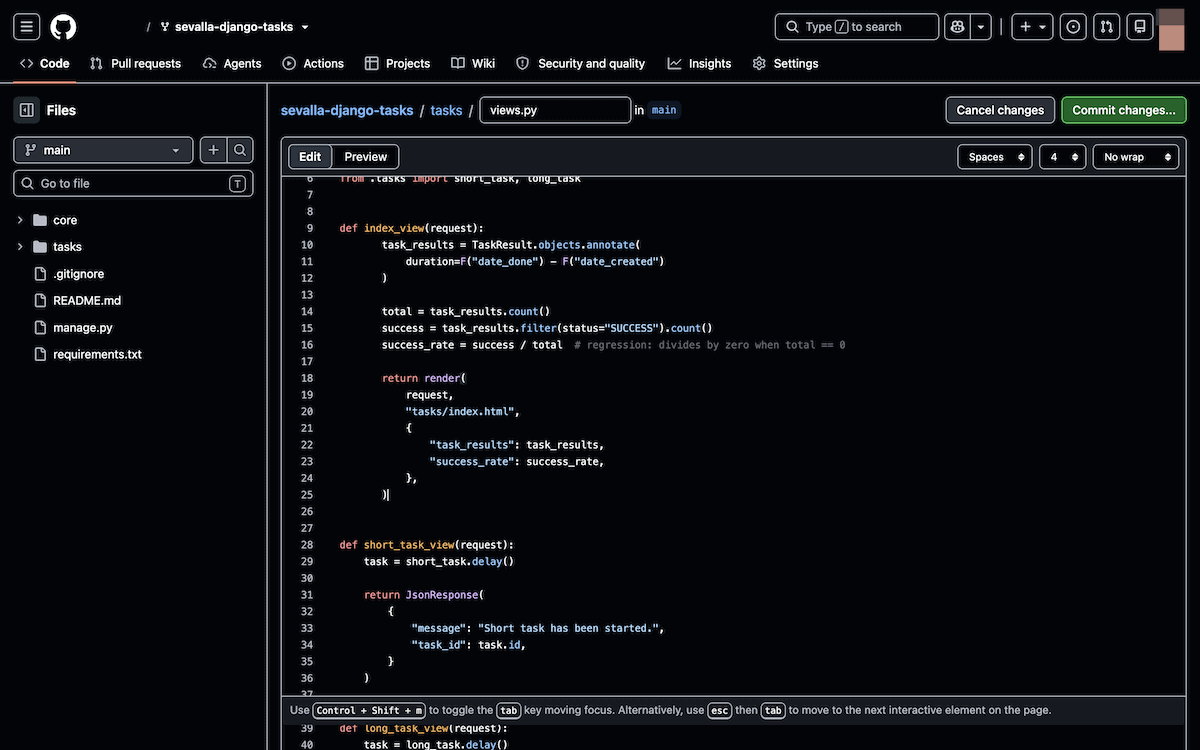
Now for the fun part! In your GitHub fork, open tasks/views.py in the browser and replace the home page view with a version that calculates a success rate:
def index_view(request):
    task_results = TaskResult.objects.annotate(
        duration=F("date_done") - F("date_created")
    )
    total = task_results.count()
    success = task_results.filter(status="SUCCESS").count()
    success_rate = success / total  # regression: divides by zero when total == 0
    return render(
        request,
        "tasks/index.html",
        {
            "task_results": task_results,
            "success_rate": success_rate,
        },
    )
This bug divides by the total count of task results without ever checking if that total is zero. Because this is the state of a fresh database, the whole request crashes.
You can commit this straight to main. Because automatic deployment is switched on, this triggers a new build. After a minute or two, reload the home page. It should now return a 500 error.
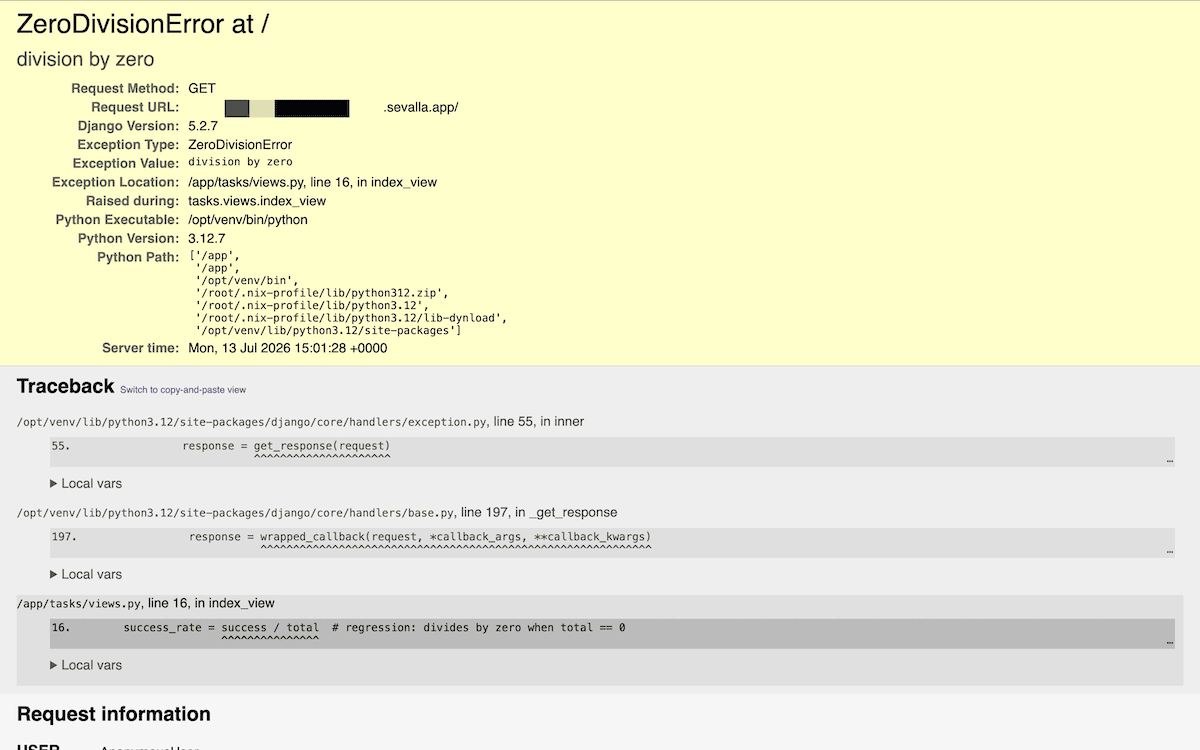
One quick note before moving on. Our example runs with DEBUG deliberately set to true, which is why the full traceback ends up in the runtime logs rather than hiding behind a generic error page. For real-world production apps, keep DEBUG off and send the details to stdout through proper logging instead.
3. Rehearse the incident yourself before the agent does
Of course, you wouldn't do this in a real scenario. However, to test the process, open the Sevalla dashboard and check that the incident shows up clearly for every signal the agent is about to query.
Load the home page a few times first to generate some traffic, then take a look at the following:
- The Analytics tab, where you should see a clear spike in 500 status codes right after your commit went live.
- In the runtime logs, where the ZeroDivisionError traceback should be sitting.
- The Deployments tab, where the most recent build should line up neatly with the moment the errors started.
This step might feel like busywork, but skipping it is the easiest way to end up with a long, confused agent session. If a signal isn't visible yet, the agent's investigation can stall or loop back on itself.
As an aside, having all of the screens and information you need within Sevalla's dashboard is one way to mitigate the time you spend hunting down bugs and issues. Most can be as simple as the ZeroDiv error we're presenting here: having the ability to go to one dashboard to gather and cross-reference evidence is a real boon.
4. Connect an AI agent and run the investigation
Sevalla's MCP server works with your current choice of AI coding agent. The Sevalla docs have quick-connect instructions for Claude Code, Cursor, Codex, OpenCode, and Windsurf. Regardless, the flow is the same: point the client at https://mcp.sevalla.com/mcp and complete an OAuth login against your Sevalla account.
For this walkthrough, we're using Cursor, mostly because its free tier is generous enough to run the whole investigation.
While you can add the Sevalla MCP server through the one-click links, you're also able to add a manual entry to .cursor/mcp.json:
{
  "mcpServers": {
    "sevalla": {
      "url": "https://mcp.sevalla.com/mcp"
    }
  }
}
Once you verify through Cursor, the MCP settings will show sevalla as enabled, along with its two tools: search and execute.
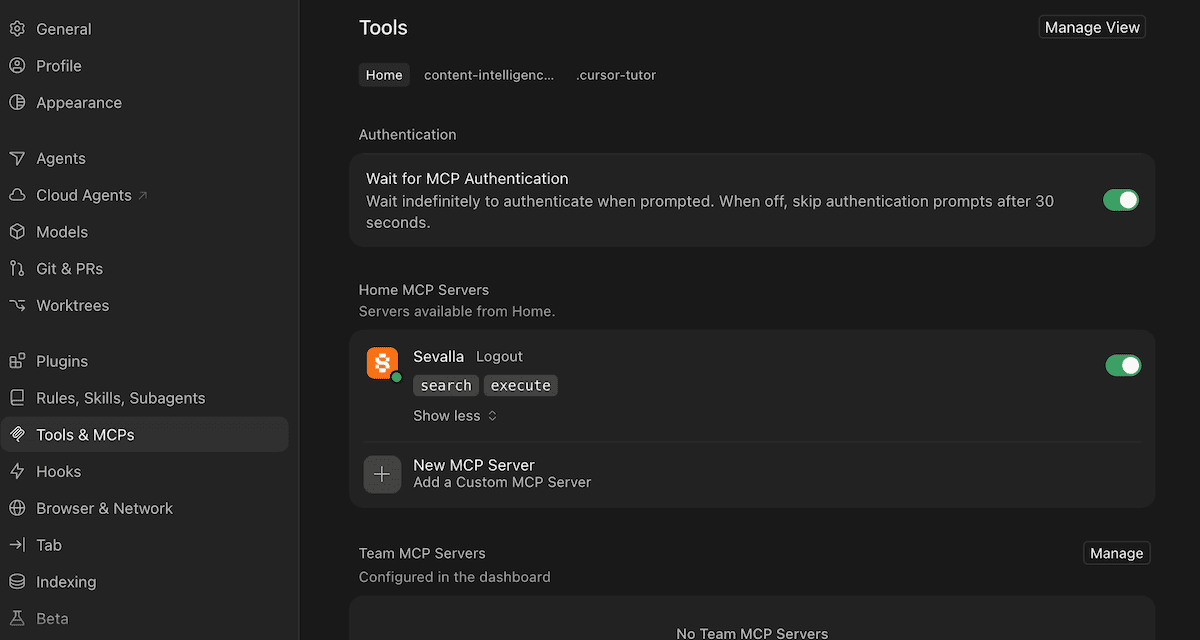
From here, open the chat panel and switch it to Agent mode, which calls Sevalla's tools and asks for your approval before each one.
You may want to leave any auto-run settings off too. The agent has genuine write access to your infrastructure at this point, including the ability to roll back a live deployment. Approving each call by hand keeps things safe.
With the connection confirmed, send one prompt to the chat:
The app named <app-name> on Sevalla has started returning 500 errors on its home page in the last few minutes. Using the Sevalla MCP tools, investigate the following:
- check the recent status codes
- read the runtime logs to find the error
- check whether a recent deployment caused it.
Tell me the root cause, then roll back to the last working deployment to restore service. Explain each step as you go.
Once you send this off, the AI agent will carry out its work and keep you informed along the way.
Inside the agent's investigation: how it finds the cause of a problem and fixes it
The agent isn't running a fixed script but figuring out the issue in real time, so it's worth understanding the process.
First, it calls search against Sevalla's OpenAPI spec to find endpoints matching status codes, logs, and deployments. Then it calls search again, this time to confirm the exact path and parameters it would need for each one.
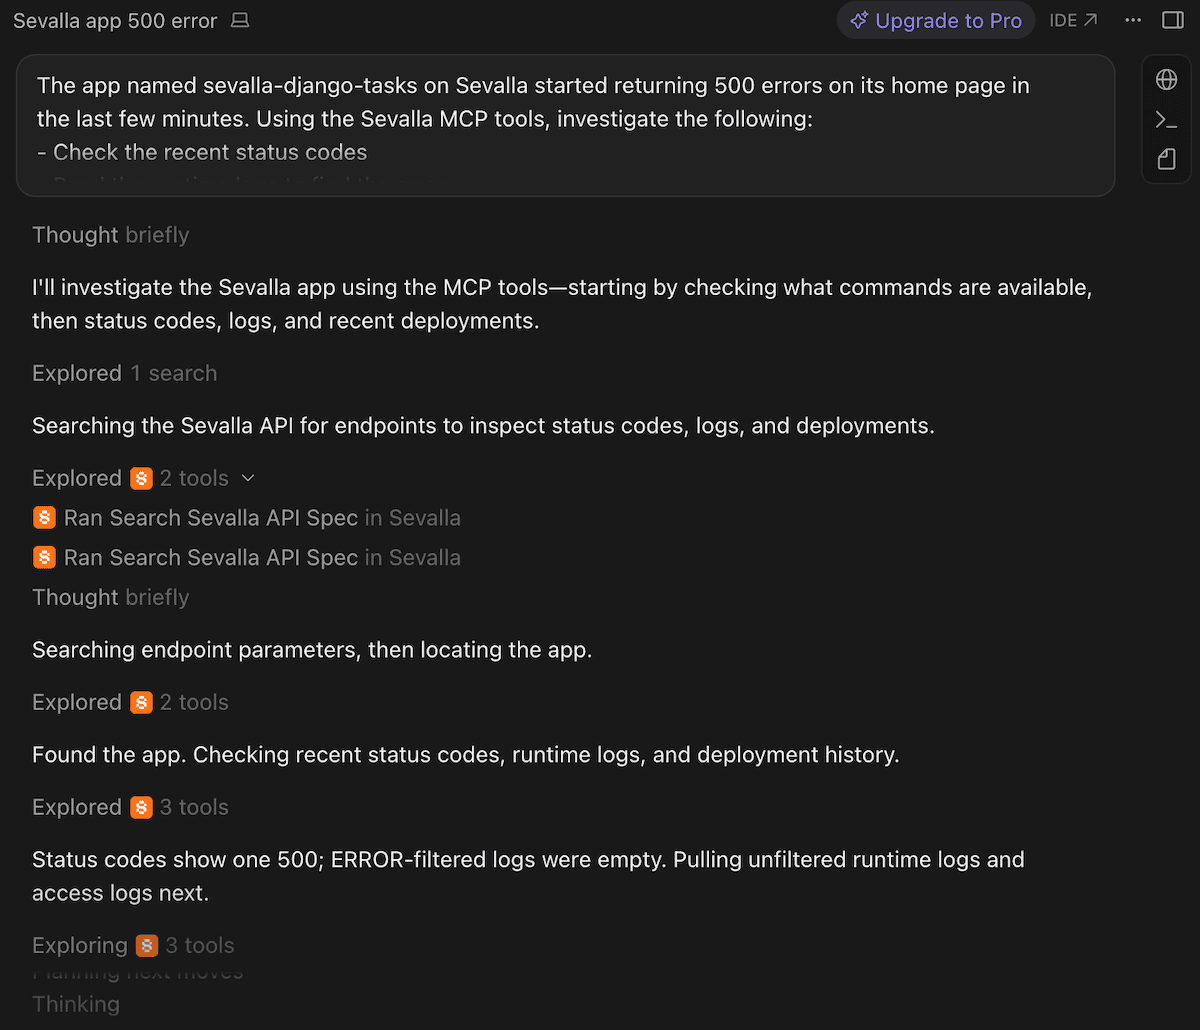
After this, it moves to execute to look up the application by name, grab its ID, then to pull the status code breakdown and the top status codes for the previous ninety minutes.
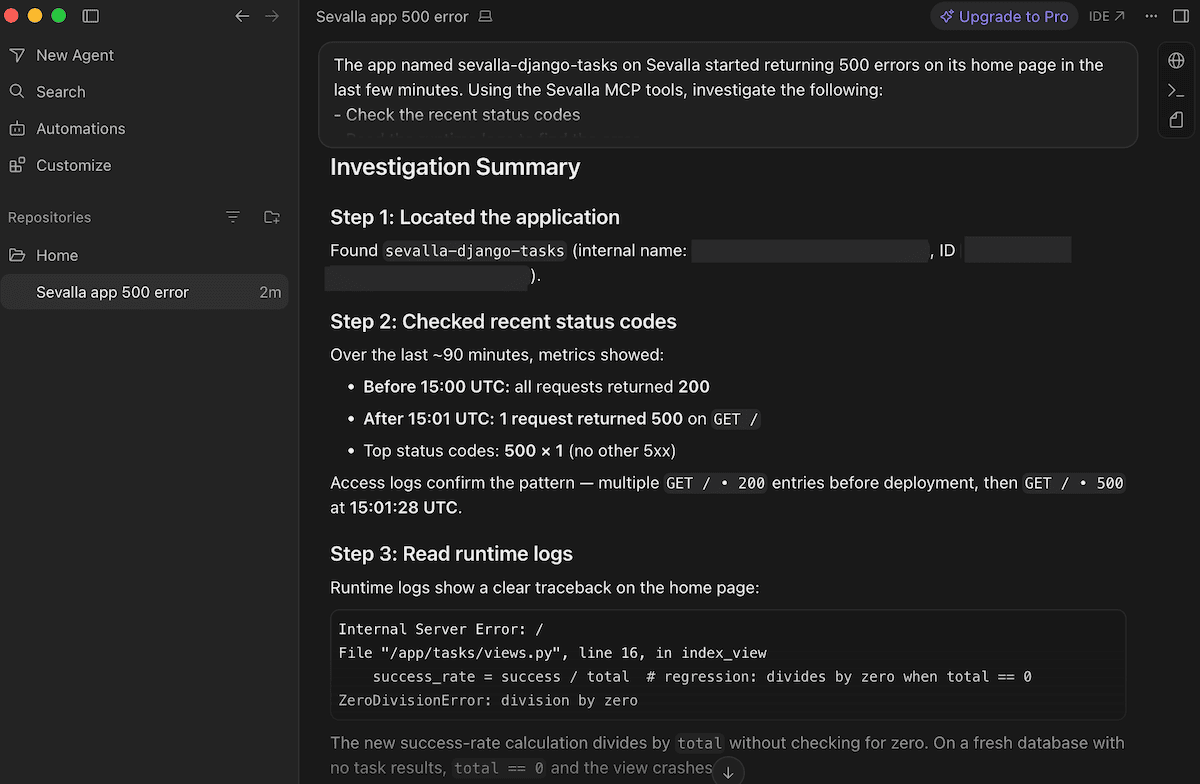
However, the first pass on the logs came back empty because the agent filtered runtime logs down to ERROR severity only. Sevalla's log entries for an unhandled Django exception don't carry that exact tag. Rather than giving up or reporting a dead end, the agent dropped the severity filter and pulled the last few log lines unfiltered. This is where the traceback showed up:
Internal Server Error: /
File "/app/tasks/views.py", line 16, in index_view
    success_rate = success / total  # regression: divides by zero when total == 0
ZeroDivisionError: division by zero
With the traceback in hand, the agent checked the deployment list and found a relevant build and commit message. This was enough for it to name the root cause.
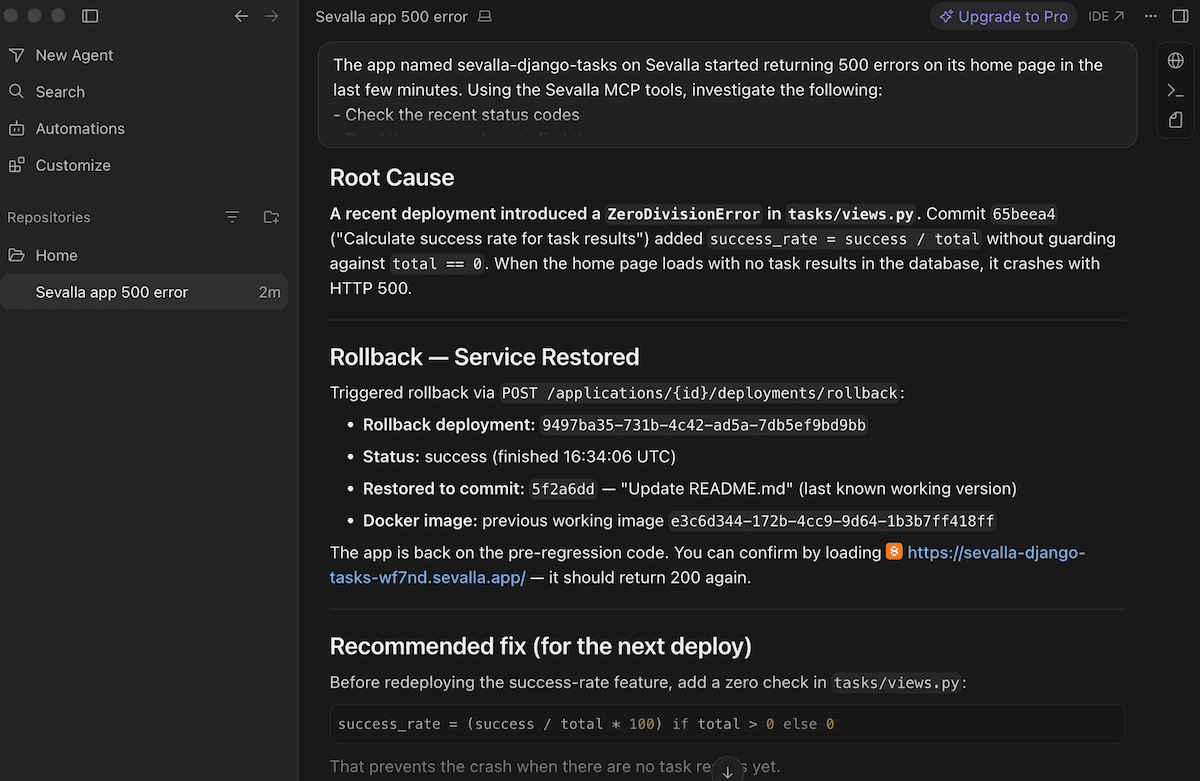
The agent then carried out a few other tasks:
- Called the rollback endpoint for the previous working deployment.
- Polled the new deployment's status every few seconds until it reported success.
- Pulled fresh access logs to confirm the home page was serving 200 statuses again.
It's worth noting how 'narrow' in scope the session stayed. For example, it wasn't asked to weigh a rollback against a forward fix, and every tool call needed manual approval. For a crash with an obvious cause and a known-good previous build, this is the right amount of autonomy.
Note also how 'contained' the incident is with regard to collecting the evidence and sourcing the problem. A messier incident deserves more scrutiny and attention, even with the same tools switched on, but most are straightforward. From only one dashboard and a chat window, you have all the data you need within reach.
Confirming the fix worked
Rolling back a fix is only half the job. The other half is checking that the fix worked as expected and cleaning up, which is as much a timesink in typical production debugging workflows as curating your evidence in the first place. The first obvious check should be to reload the app's home page. You should see the same yellow "No tasks found" box from before the regression.
Next, head back into the Sevalla dashboard and check the following:
- Deployments. The active deployment should match the known-good build from before the regression shipped, not just show a generic 'success' status next to something new.
- Analytics. The status code graph should show the 500 spike tapering off cleanly at the point of rollback, with 200 codes picking up after. This is a solid confirmation of a fix, rather than just going on the home page alone.
If you want to go one step further, open the runtime logs and confirm the new gunicorn worker started with no leftover errors from the previous deployment.
The takeaway: what this demo shows, and where to go next
What we've just walked through is a real production incident, handled almost entirely through conversation and the Sevalla dashboard. Most bugs are simple errors, but switching between several screens and tools will lengthen the time it takes to fix a problem. An AI agent connecting through Sevalla's MCP server can find the cause of a problem, correlate it against a bad deployment, and roll things back within about 15 minutes.
From here, it's worth trying the same workflow against an app of your own, ideally with a real bug. You might also experiment with the prompt itself to ask the agent about checking resource usage. Sevalla's MCP server exposes the same API a dashboard uses, so there's plenty of room to explore beyond rollbacks alone.
An agent isn't going to replace your engineers, however. The biggest issue with debugging is the operational complexity that can drag your team away from other critical tasks. Using an agent alongside an MCP removes that operational burden and gives your engineers and devs time and headspace.
However, Sevalla covers more than debugging: it's a premium solution for application hosting, managed databases, static sites, and object storage, all without the infrastructure upkeep that usually comes attached. Sign up, and you'll get free credit awarded to your account.